P/L CalculatorDescription of the P/L Calculator Indicator
The P/L Calculator is a dynamic TradingView indicator designed to provide traders with real-time insights into profit and loss metrics for their trades. It visualizes key levels such as entry price, profit target, and stop-loss, while also calculating percentage differences and net profit or loss, factoring in fees.
Features:
Customizable Input Parameters:
Entry Price: Define the starting price of the trade.
Profit and Stop-Loss Levels (%): Set percentage thresholds for targets and risk levels.
USDT Amount: Specify the trade size for precise calculations.
Trade Type: Choose between "Long" or "Short" positions.
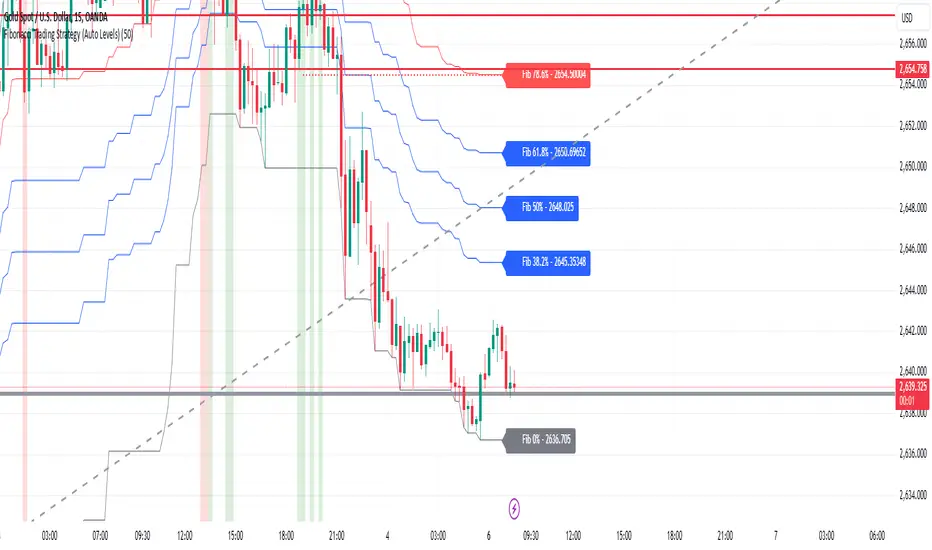
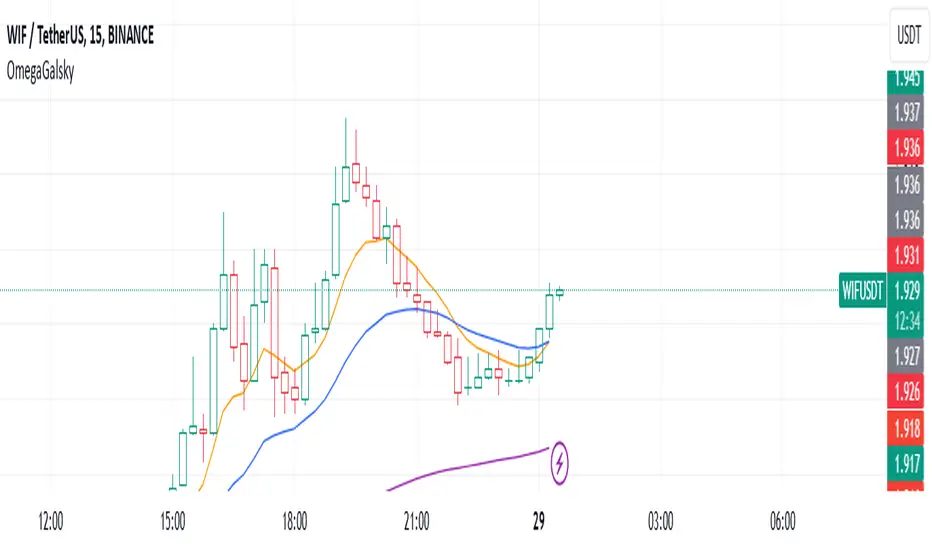
Visual Representation:
Entry Price, Profit Target, and Stop-Loss levels are plotted as horizontal lines on the chart.
Line styles, colors, and thicknesses are fully customizable for better visibility.
Real-Time Metrics:
Percentage difference between the live price and the entry price is calculated dynamically.
Profit/Loss (P/L) and fees are computed in real time to display net profit or loss.
Alerts:
Alerts are triggered when:
The live price hits the profit target.
The live price crosses the stop-loss level.
The price reaches the specified entry level.
A user-defined percentage difference is reached.
Labels and Annotations:
Displays percentage difference, P/L, and fee information in a clear label near the live price.
Custom Fee Integration:
Allows input of trading fees (%), enabling accurate net profit or loss calculations.
Price Scale Visualization:
Displays the percentage difference on the price scale for enhanced context.
Use Case:
The P/L Calculator is ideal for traders who want to monitor their trades' performance and make informed decisions without manually calculating metrics. Its visual cues and alerts ensure you stay updated on critical levels and price movements.
This indicator supports a wide range of trading styles, including swing trading, scalping, and position trading, making it a versatile tool for anyone in the market.
Pine Script® göstergesi